Position paper: From libraries as patchwork to datasets as assemblages?

Photo of beach view

My position paper for Always Already Computational: Collections as Data. Every attendee wrote one – read the others at Collections as Data – National Forum Position Statements.

From libraries as patchwork to datasets as assemblages?

Dr Mia Ridge, Digital Curator, British Library

The British Library's collections are vast, and vastly varied, with 180-200 million items in most known languages. Within that, there are important, growing collections of manuscript and sound archives, printed materials and websites, each with its own collecting history and cataloguing practices. Perhaps 1-2% of these collections have been digitised, a process spanning many years and many distinct digitisation projects, and an ensuing patchwork of imaging and cataloguing standards and licences. This paper represents my own perspective on the challenges of providing access to these collections and others I've worked with over the years.

Many of the challenges relate to the volume and variety of the collections. The BL is working to rationalise the patchwork of legacy metadata systems into a smaller number of strategic systems.[1] Other projects are ingesting masses of previously digitised items into a central system, from which they can be displayed in IIIF-compatible players.[2]

The BL has had an 'open metadata' strategy since 2010, and published a significant collection of metadata, the British National Bibliography, as linked open data in 2011.[3] Some digitised items have been posted to Wikimedia Commons,[4] and individual items can be downloaded from the new IIIF player (where rights statements allow). The BL launched a data portal, https://data.bl.uk/, in 2016. It's work-in-progress – many more collections are still to be loaded, the descriptions and site navigation could be improved – but it represents a significant milestone many years in the making. The BL has particularly benefitted from the work of the BL Labs team in finding digitised collections and undertaking the paperwork required to make the freely available. The BL Labs Awards have helped gather examples for creative, scholarly and entrepreneurial uses of digitised collections collection re-use, and BL Labs Competitions have led to individual case studies in digital scholarship while helping the BL understand the needs of potential users.[5] Most recently, the BL has been working with the BBC's Research and Education Space project,[6] adding linked open data descriptions about articles to its website so they can be indexed and shared by the RES project.

In various guises, the BL has spent centuries optimising the process of delivering collection items on request to the reading room. Digitisation projects are challenging for systems designed around the 'deliverable item', but the digital user may wish to access or annotate a specific region of a page of a particular item, but the manuscript itself may be catalogued (and therefore addressable) only at the archive box or bound volume level. The visibility of research activities with items in the reading rooms is not easily achieved for offsite research with digitised collections. Staff often respond better to discussions of the transformational effect of digital scholarship in terms of scale (e.g. it's faster and easier to access resources) than to discussions of newer methods like distant reading and data science.

The challenges the BL faces are not unique. The cultural heritage technology community has been discussing the issues around publishing open cultural data for years,[7]in part because making collections usable as 'data' requires cooperation, resources and knowledge from many departments within an institution. Some tensions are unavoidable in enhancing records for use externally – for example curators may be reluctant or short of the time required to pin down their 'probable' provenance or date range, let alone guess at the intentions of an earlier cataloguer or learn how to apply modern ontologies in order to assign an external identifier to a person or date field.

While publishing data 'as is' in CSV files exported from a collections management system might have very little overhead, the results may not be easily comprehensible, or may require so much cleaning to remove missing, undocumented or fuzzy values that the resulting dataset barely resembles the original. Publishing data benefits from workflows that allow suitably cleaned or enhanced records to be re-ingested, and export processes that can regularly update published datasets (allowing errors to be corrected and enhancements shared), but these are all too rare. Dataset documentation may mention the technical protocols required but fail to describe how the collection came to be formed, what was excluded from digitisation or from the publishing process, let alone mention the backlog of items without digital catalogue records, let alone digitised images. Finally, users who expect beautifully described datasets with high quality images may be disappointed when their download contains digitised microfiche images and sparse metadata.

Rendering collections as datasets benefits from an understanding of the intangible and uncertain benefits of releasing collections as data and of the barriers to uptake, ideally grounded in conversations with or prototypes for potential users. Libraries not used to thinking of developers as 'users' or lacking the technical understanding to translate their work into benefits for more traditional audiences may find this challenging. My hope is that events like this will help us deal with these shared challenges.

[1] The British Library, ‘Unlocking The Value: The British Library’s Collection Metadata Strategy 2015 – 2018’.

[2] The International Image Interoperability Framework (IIIF) standard supports interoperability between image repositories. Ridge, ‘There’s a New Viewer for Digitised Items in the British Library’s Collections’.

[3] Deloit et al., ‘The British National Bibliography: Who Uses Our Linked Data?’

[4] https://commons.wikimedia.org/wiki/Commons:British_Library

[5] http://www.bl.uk/projects/british-library-labs, http://labs.bl.uk/Ideas+for+Labs

[6] https://bbcarchdev.github.io/res/

[7] For example, the 'Museum API' wiki page listing machine-readable sources of open cultural data was begun in 2009 http://museum-api.pbworks.com/w/page/21933420/Museum%C2%A0APIs following discussion at museum technology events and on mailing lists.
Photo of beach view
The view from UC Santa Barbara is alright, I suppose

Workshop: Data visualisation for 'Beyond the Black Box'

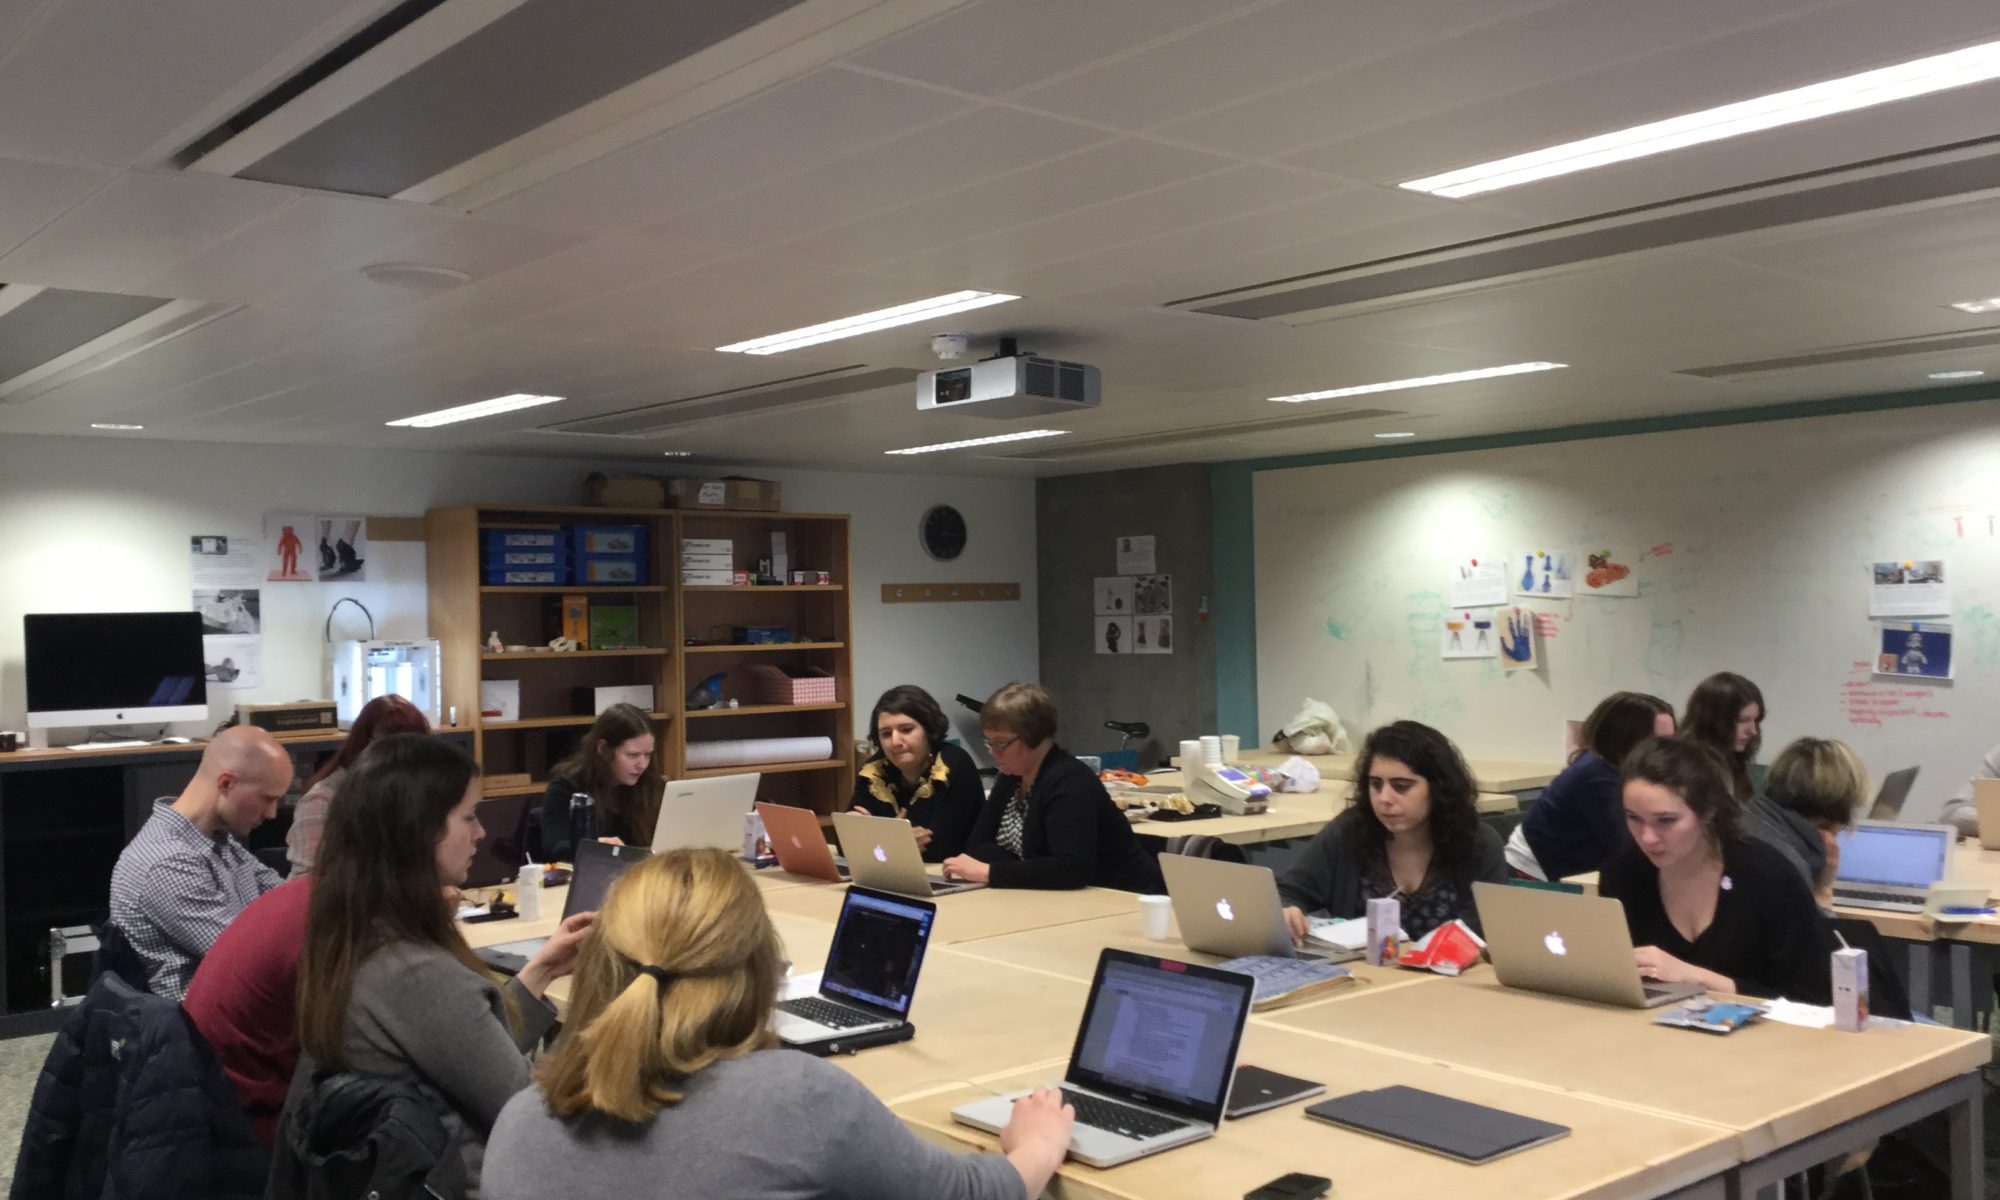
Beyond the Black Box is a programme of advanced digital humanities workshops at the University of Edinburgh, designed to foster statistical, algorithmic and quantitative literacy. It is directed by Anouk Lang, administered by Robyn Pritzker and funded by a grant from the British Academy.

I was invited to give a workshop on Data Visualisation. My slides are below, and my exercises are collected in a Google Doc for easier access to links.

I developed a new exercise for this and the CHASE workshop, and have blogged about it at Trying computational data generation and entity extraction.

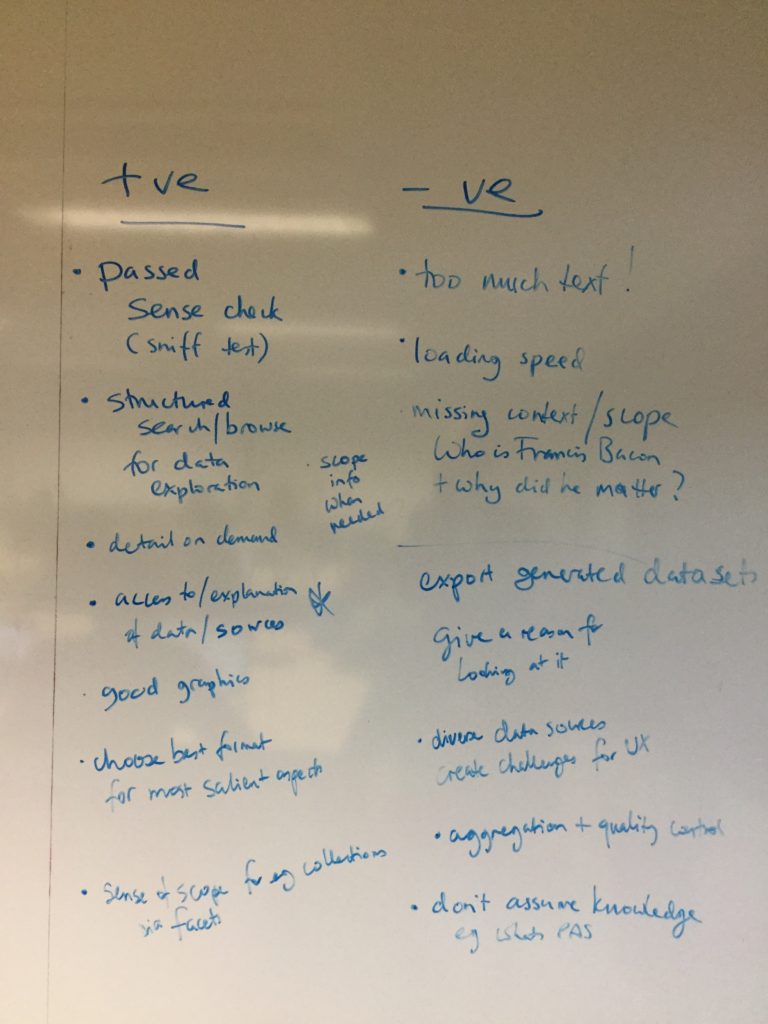
Discussing positive and negative traits of interactive scholarly visualisations.

Workshop: Information Visualisation, CHASE Arts and Humanities in the Digital Age 2017

I ran a full-day workshop on Information Visualisation for the CHASE Arts and Humanities in the Digital Age training programme at Birkbeck, London, in February 2017. The abstract:

Visualising data to understand it or convince others of an argument contained within it has a long history. Advances in computer technology have revolutionised the process of data visualization, enabling scholars to ask increasingly complex research questions by analysing large scale datasets with freely available tools.

This workshop will give you an overview of a variety of techniques and tools available for data visualisation and analysis in the arts and humanities. The workshop is designed to help participants plan visualisations by discussing data formats used for the building blocks of visualisation, such as charts, maps, and timelines. It includes discussion of best practice in visual design for data visualisations and practical, hands-on activities in which attendees learn how to use online tools such as Viewshare to create visualisations.

At the end of this course, attendees will be able to:

  • Create a simple data visualisation
  • Critique visualisations in terms of choice of visualisation type and tool, suitability for their audience and goals, and other aspects of design
  • Recognise and discuss how data sets and visualisation techniques can aid researchers

Please remember to bring your laptop.

Slides

Exercises for CHASE's ADHA 2017 Introduction to Information Visualisation

  • Exercise 1: comparing n-gram tools
  • Exercise 2: Try entity extraction
  • Exercise 3: exploring scholarly data visualisations
  • Viewshare Exercise 1: Ten minute tutorial – getting started
  • Viewshare Exercise 2: Create new views and widgets

Chapter: 'The contributions of family and local historians to British history online'

Participatory Heritage, edited by Henriette Roued-Cunliffe and Andrea Copeland, has just been published by Facet.

A pre-print is online at https://hcommons.org/deposits/item/hc:38017

My chapter is 'The contributions of family and local historians to British history online'. My abstract:

Community history projects across Britain have collected and created images, indexes and transcriptions of historical documents ranging from newspaper articles and photographs, to wills and biographical records. Based on analysis of community- and institutionally-led participatory history sites, and interviews with family and local historians, this chapter discusses common models for projects in which community historians cooperated to create digital resources. For decades, family and local historians have organised or contributed to projects to collect, digitise and publish historical sources about British history. What drives amateur historians to voluntarily spend their time digitising cultural heritage? How do they cooperatively or collaboratively create resources? And what challenges do they face?

My opening page:

IN 1987, THE Family History Department of the Church of the Latter Day Saints began a project with the British Genealogical Records Users Committee to transcribe and index the 1881 British census. Some community history societies were already creating indexes for the 1851 census, so they were well placed to take on another census project. Several tons of photocopies were distributed to almost 100 family history societies for double transcription and checking; later, a multi-million-dollar mainframe computer created indexes from the results (Young, 1996, 1998a; Tice, 1990). This ‘co-operative indexing’ took eight years – the process of assigning parts for transcription alone occupied 43 months – and while the project was very well received, in 1998 it was concluded that ‘a national project of this scope has proved too labour intensive, time consuming and expensive’ to be repeated (Young, 1998b). However, many years later, the US 1940 census was indexed in just four months by over 160,000 volunteers (1940 US Census Community Project, 2012), and co-operative historical projects flourish.

This example illustrates the long history of co-operative transcription and indexing projects, the significant contribution they made to the work of other historians and the vital role of community history organizations and volunteers in participatory heritage projects. The difference between the reach and efficiency of projects initiated in the 1980s and the 2010s also highlights the role of networked technologies in enabling wider participation in cooperative digitization projects. This chapter examines the important contributions of community historians to participatory heritage, discussing how family and local historians have voluntarily organized or contributed to projects to collect, digitize and publish historical sources about British history. This insight into grassroots projects may be useful for staff in cultural heritage institutions who encounter or seek to work with community historians.

The questions addressed in this chapter are drawn from research which sought to understand the impact of participatory digital history projects on users. This research involved reviewing a corpus of over 400 digital history projects, analysing those that aimed to collect, create or enhance records about historical materials. The corpus included both community- and institutionally led participatory history sites. Points of analysis included ‘microcopy’ (small pieces of text such as slogans, instructions and navigation) and the visible affordances, or website interface features, that encourage, allow or disable various participatory functions.

Bio

Mia Ridge is a Digital Curator in the British Library’s Digital Scholarship team. She has a PhD in digital humanities (2015, Department of History, Open University) entitled Making Digital History: the impact of digitality on public participation and scholarly practices in historical research. Previously, she conducted human-computer interaction-based research on crowdsourcing in cultural heritage.

9781783301232

2016: an overview

This page is a work in progress…

In December I gave a talk for the Association for Project Management’s Knowledge Management SIG event on ‘What does big data mean for project and knowledge managers?’.

In November 2016 I was in Riga, Latvia to give the closing keynote at the Europeana Network Association AGM 2016. In October I spoke at 'What should be in your digital toolbox', gave a keynote, 'Digital history: evolution or transformation?' at The Science of Evolution and the Evolution of the Sciences conference in Leuven, Belgium around October 12th and 13th, 2016 and at Internet Librarian International then chaired the Museums Computer Group's Museums+Tech conference. In August I was in York for 'Negotiating Expertise' and in Helsinki for Museum Theme Days 2016 in September.

In June 2016 I was in Luxembourg for a workshop on Network Visualisation in the Cultural Heritage Sector. My talk notes for Network visualisations and the ‘so what?’ problem are online. I also keynoted at LIBER (Ligue des Bibliothèques Européennes de Recherche – Association of European Research Libraries) in Helsinki. My slides are online but may not make much sense without notes.

In March 2016 I was at Rice University in Houston then Austin (at the iSchool in UT Austin then St Edwards), then I was on a panel on 'Build the Crowdsourcing Community of Your Dreams' at SXSWi 2016 with Ben Brumfield, Meghan Ferriter and Siobhan Leachman.

In January 2016 I was back in Oxford for a workshop on 'DIY Digitisation' at the Bodleian Libraries.