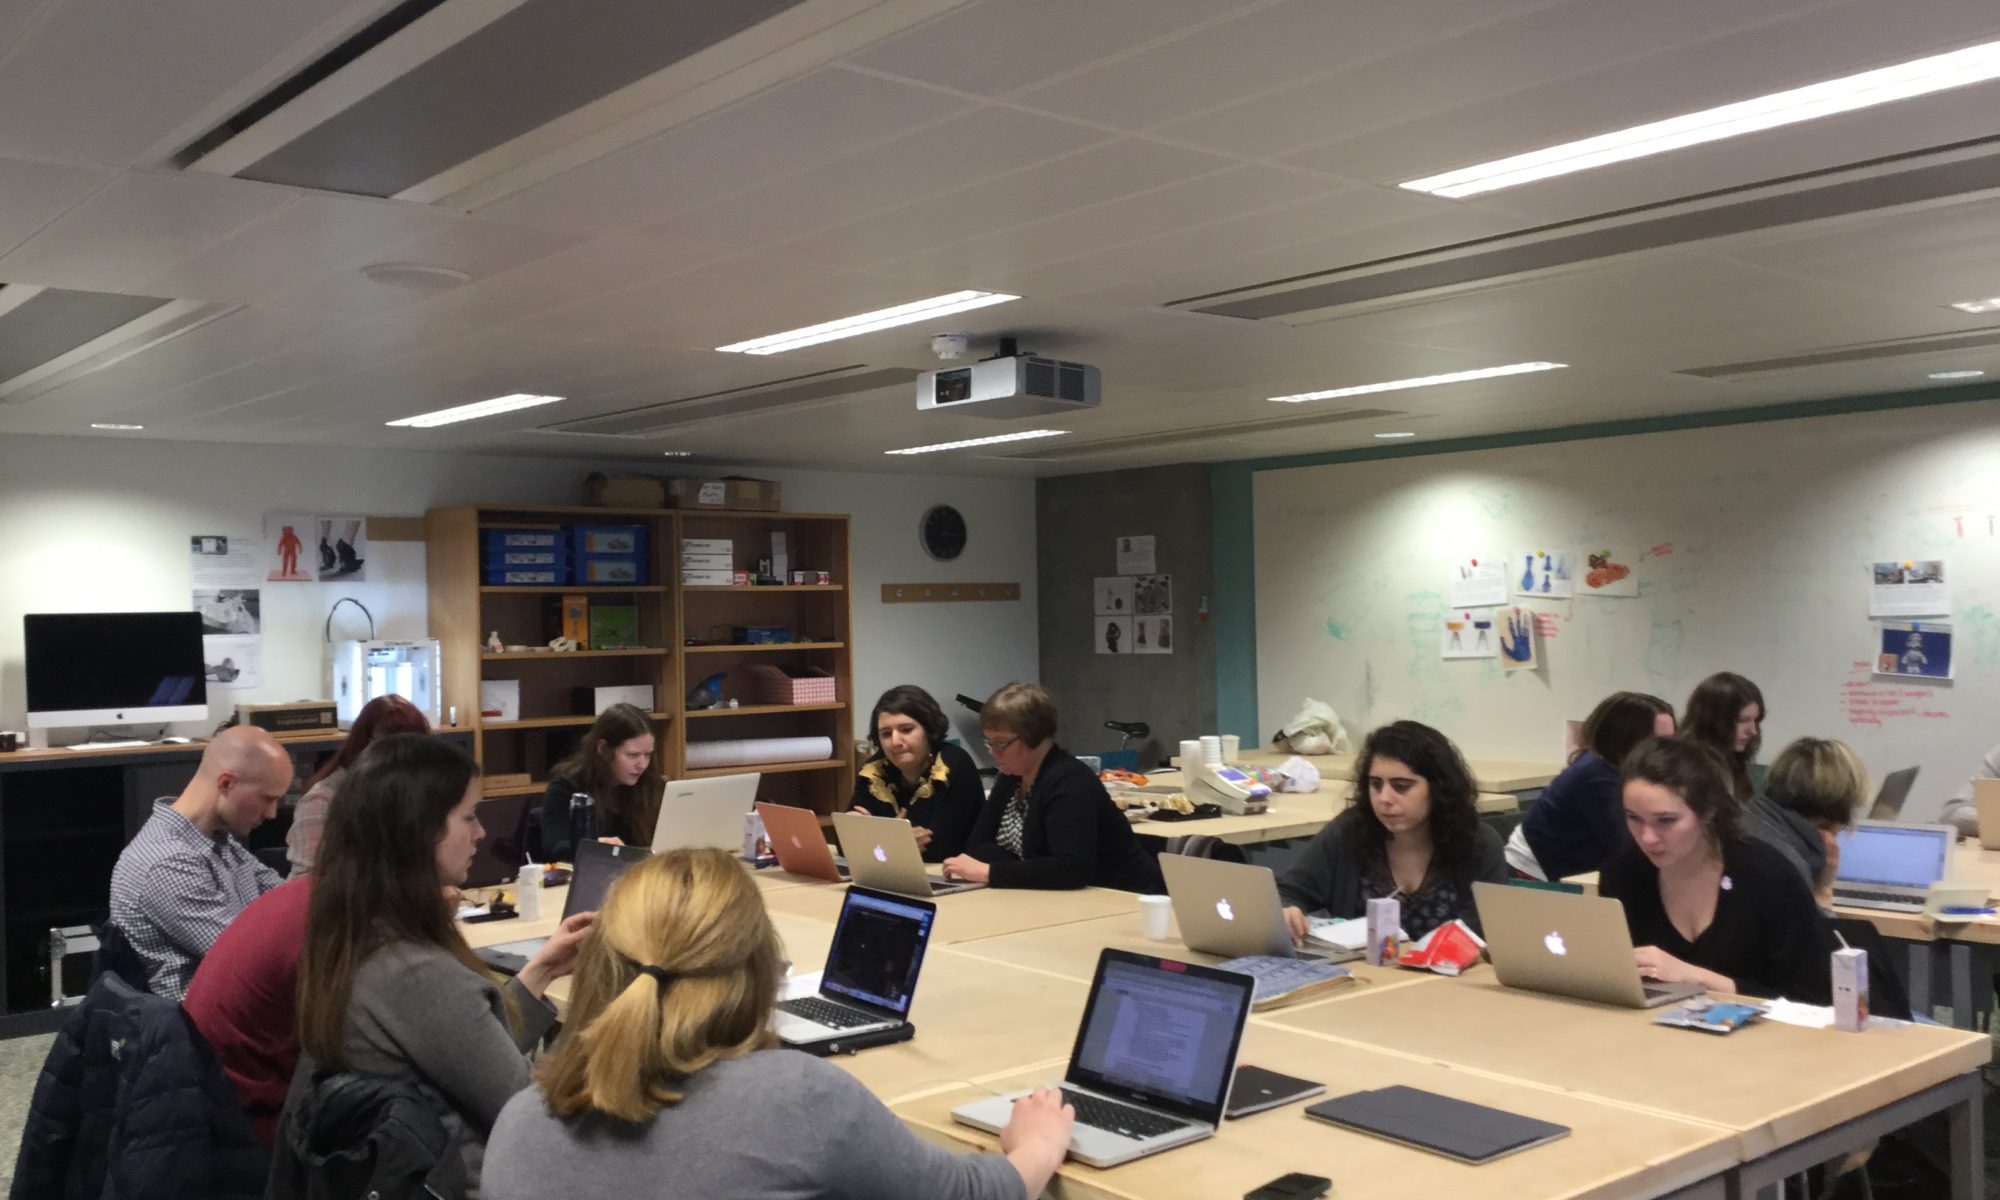
I ran a full-day workshop on Information Visualisation for the CHASE Arts and Humanities in the Digital Age training programme at Birkbeck, London, in February 2017. The abstract:
Visualising data to understand it or convince others of an argument contained within it has a long history. Advances in computer technology have revolutionised the process of data visualization, enabling scholars to ask increasingly complex research questions by analysing large scale datasets with freely available tools.
This workshop will give you an overview of a variety of techniques and tools available for data visualisation and analysis in the arts and humanities. The workshop is designed to help participants plan visualisations by discussing data formats used for the building blocks of visualisation, such as charts, maps, and timelines. It includes discussion of best practice in visual design for data visualisations and practical, hands-on activities in which attendees learn how to use online tools such as Viewshare to create visualisations.
At the end of this course, attendees will be able to:
- Create a simple data visualisation
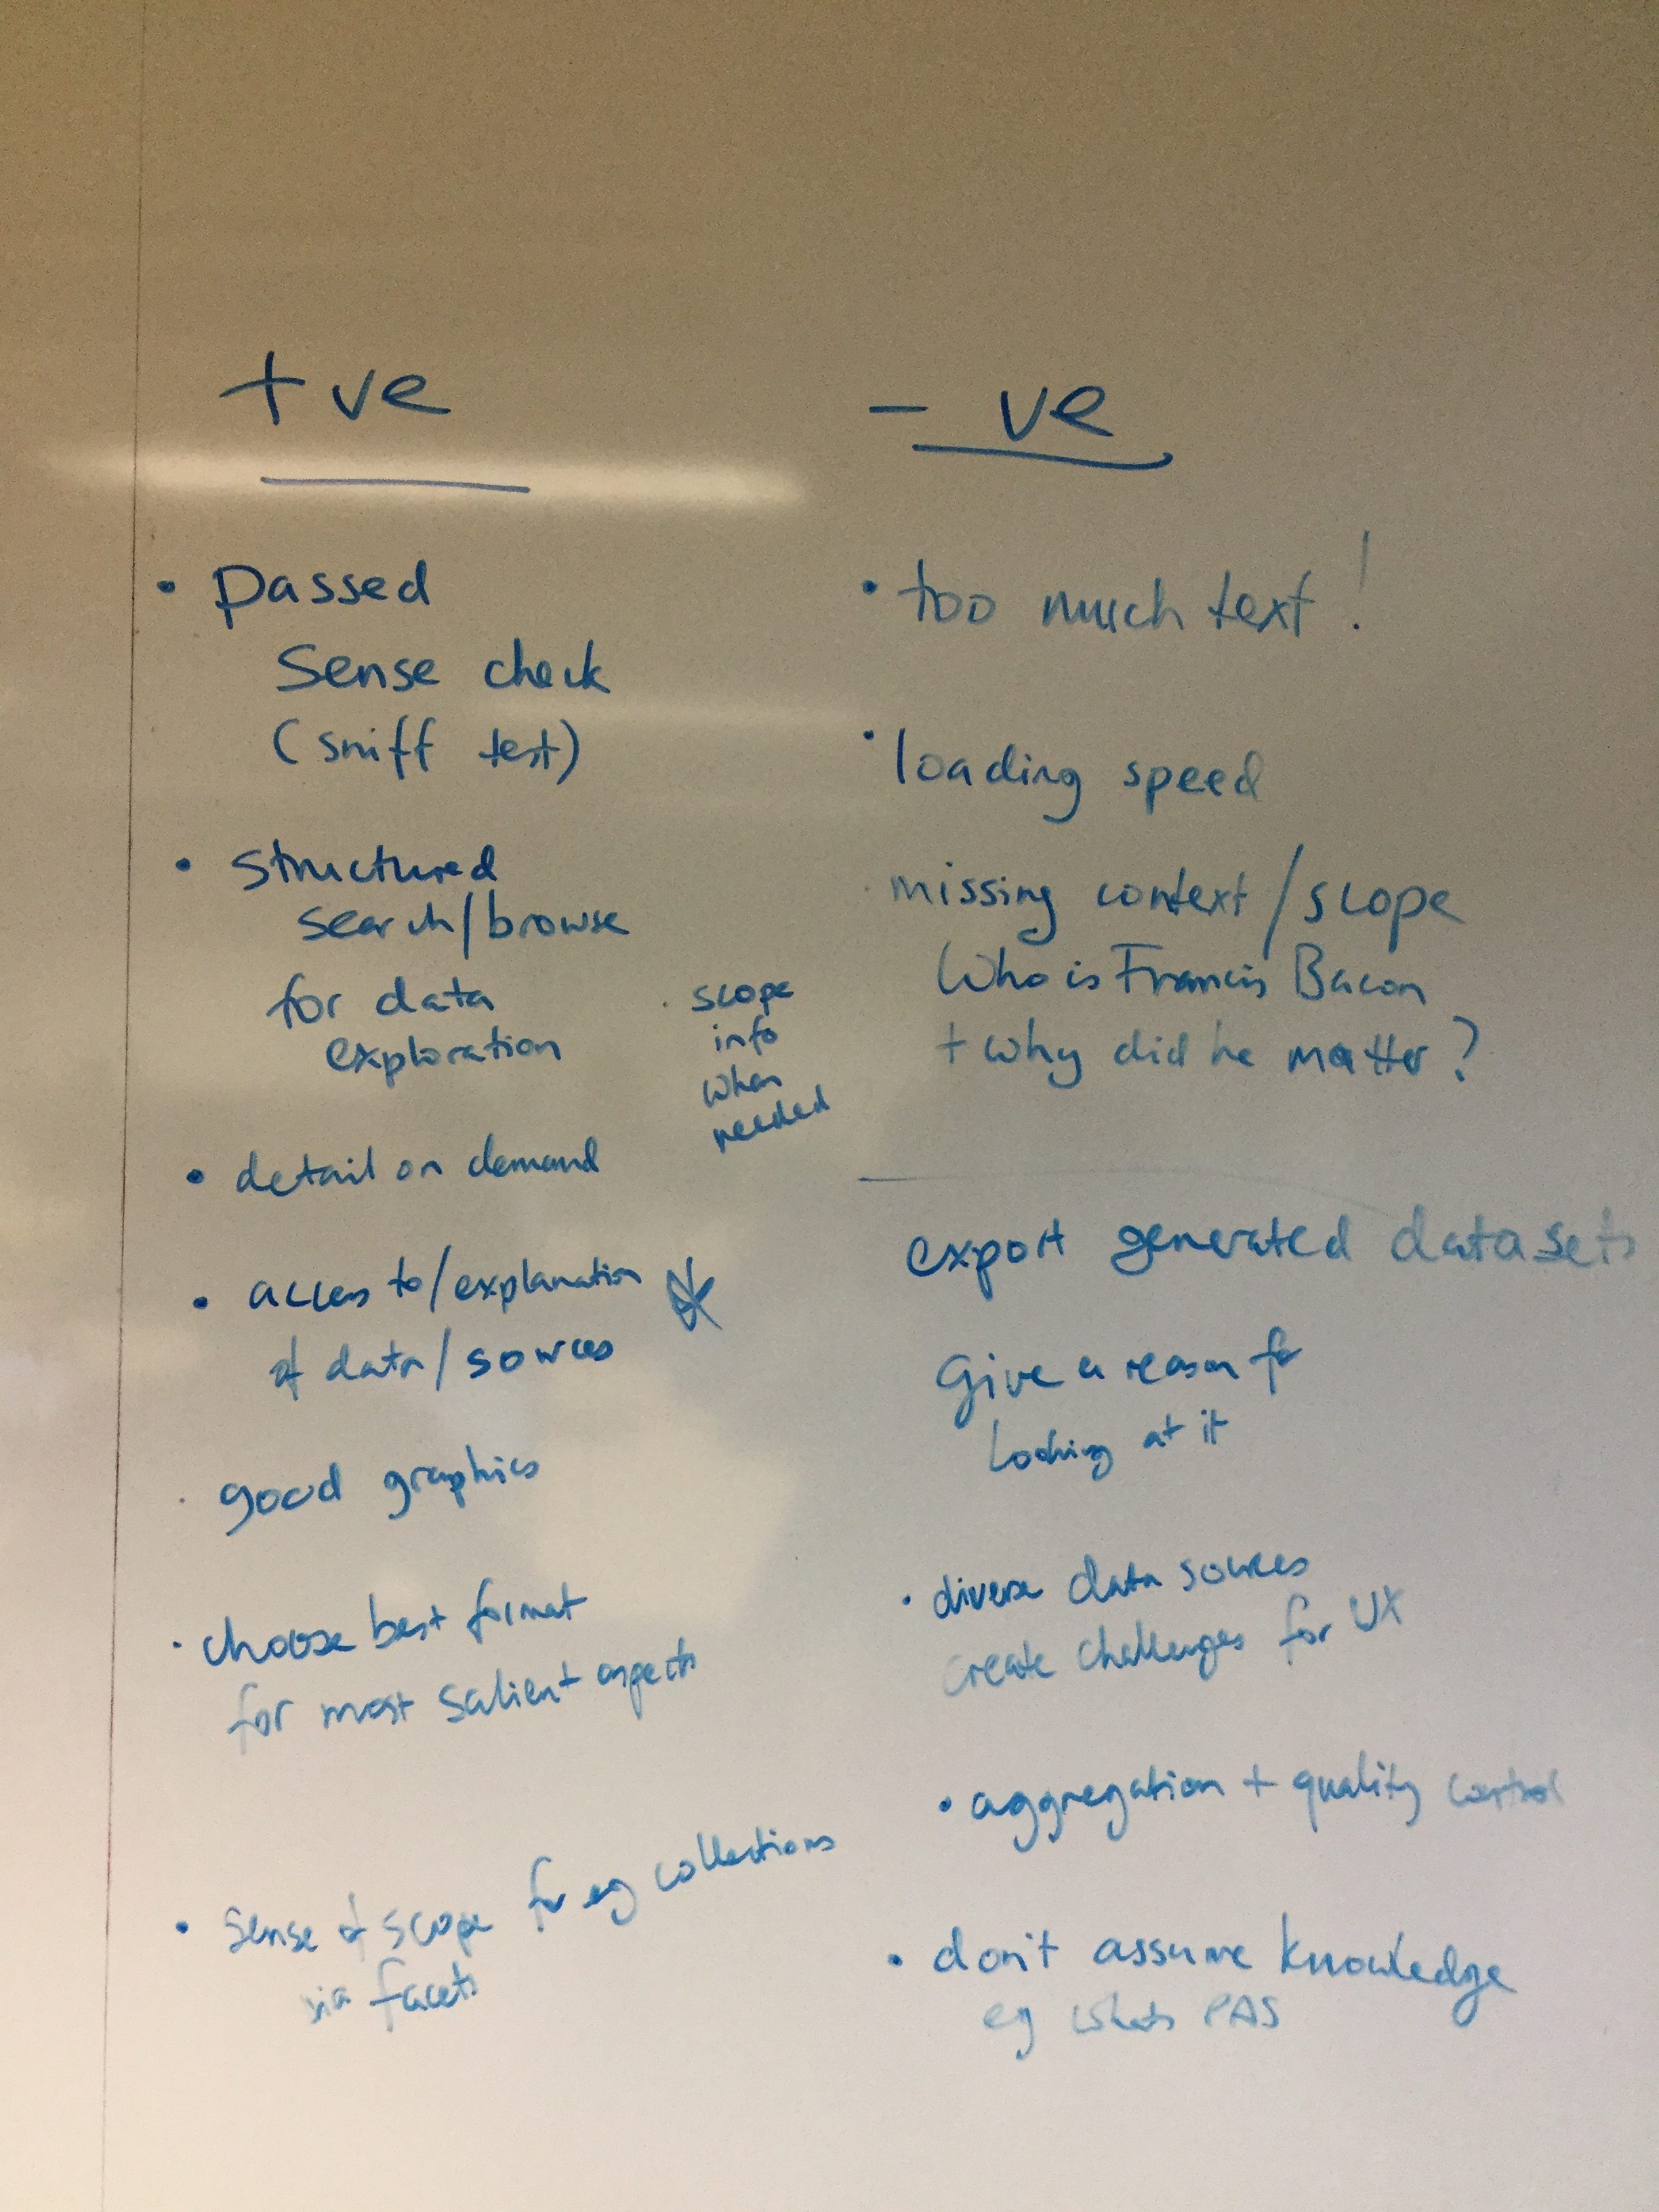
- Critique visualisations in terms of choice of visualisation type and tool, suitability for their audience and goals, and other aspects of design
- Recognise and discuss how data sets and visualisation techniques can aid researchers
Please remember to bring your laptop.
- Exercise 1: comparing n-gram tools
- Exercise 2: Try entity extraction
- Exercise 3: exploring scholarly data visualisations
- Viewshare Exercise 1: Ten minute tutorial – getting started
- Viewshare Exercise 2: Create new views and widgets