A collection of links for further reading for the British Library's Digital Scholarship course on 'Data Visualisation for Analysis in Scholarly Research'. I update this each time I teach the course, so please leave a comment if you know of any great sources I've missed. Slides and exercises for each version of the workshop are below. Many thanks to workshop participants for their feedback, as it directly helps make the next version more effective. And of course huge thanks to Nora McGregor and the British Library's Digital Scholarship team!
Last updated January 2018. Between course revisions I add interesting visualisations to my Scholarly Vision tumblr and pinboard.
Links for exercises
- Data Visualisation for Analysis in Scholarly Research_201509 (PDF)
- Exercises for Data Visualisation for Analysis in Scholarly Research_201509 (PDF)
- Tate_artists_data_prepared (Excel/CSV files)
Previous dataset:
Visualisations as political storytelling
In your browser, explore two or more of the links below
Elections provide opportunities to compare visualisations based on a theme, as each media outlet competes to tell the most compelling visual stories. Take a few minutes to explore and compare two or more of these:
- NY Times: How Trump Won the Election According to Exit Polls http://www.nytimes.com/interactive/2016/11/08/us/elections/exit-poll-analysis.html?smid=pl-share&_r=1
- NY Times: How Trump Reshaped the Election Map http://www.nytimes.com/interactive/2016/11/08/us/elections/how-trump-pushed-the-election-map-to-the-right.html?_r=0
- Washington Post: How Trump redrew the electoral map, from sea to shining sea https://www.washingtonpost.com/graphics/politics/2016-election/election-results-from-coast-to-coast/
- FT.com: How Trump won: the full results https://ig.ft.com/us-elections/results
- ABC News: How Donald Trump won http://www.abc.net.au/news/2016-11-10/us-election-results-how-the-president-won/8008448
- Pew Research Centre: Republican voters’ path to backing Donald Trump
- http://www.people-press.org/interactives/gop-candidate-switching/
Scholarly visualisations to explore and discuss
- Visualizing Emancipation
- Mapping the Republic of Letters
- Locating London's Past
- GapVis Ancient Places
- Digital Harlem
- Digital Public Library of America (DPLA) map, timeline, bookshelf
- Orbis
- Kindred Britain
- Lost Change
- The State of the Union in Context
Trying entity recognition and data enhancement
I've suggested a few tools as they each have different strengths and weaknesses. If you don't have any of your own text to hand, try a paragraph or two of text from a news website.
- Stanford Natural Language Processing Group tool, 'An integrated suite of natural language processing tools for English in Java, including tokenization, part-of-speech tagging, named entity recognition, parsing, and coreference'.
- Voyant Tools, their principles and user guide (also this post on Text Mining with Voyant from Lincoln Logarithms)
- You can also try the entity recognition extension for Refine from freeyourmetadata.com
Other visualisation exercises
- Instructions for creating simple graphs with Excel's Pivot Tables and Tate's artist data.
- Gephi's 'Quick Start' tutorial will teach you the basics of network visualisation
- The Java-based Topic Modeling Tool provides a simple GUI for trying topic modeling
Cleaning data as preparation for visualisation
- I recommend the downloadable tool OpenRefine (was Google Refine)
- Free Your Metadata's example of Cleaning metadata in Refine
- A Librarian’s Guide to OpenRefine
- A Wrangling Example With OpenRefine: Making “Oven Ready Data”
Sources cited and references to find out more
Types of visualisations
- A Tour through the Visualization Zoo: A survey of powerful visualization techniques, from the obvious to the obscure, Jeffrey Heer, Michael Bostock, Vadim Ogievetsky
- Chart and image gallery: 30+ free tools for data visualization and analysis provides a useful overview chart that can be sorted by skill level, platform, etc, with related reviews and screenshots. See also A Periodic Table of Visualization Methods, Brian Suda's Top 20 data visualisation tools, or idea.org's Great tools for data visualization.
- Selected tools for visualisations, a curated selection from datavisualization.ch – recommended
- Narrative Visualization: Telling Stories with Data, Edward Segel, Jeffrey Heer
- Timelines: the London 2012 Olympic Games on Twitter, emoto (also an example of visualising sentiment analysis, where computational techniques are used to detect subjective emotions)
- Timelines: Wellcome Library History of Genetics timeline
- N-grams: Google Ngram viewer
- N-grams: bookworm Open Library
- Text mining for Historians
- Topic mining: Mining for meanings, Tim Sherratt
- Topic mining: Mining the Dispatch, Robert K. Nelson
- Topic modelling: Topic Modeling Tool
- Network visualisations: Les Misérables character interaction presented as a force directed graph.
- Network visualisations: O rocks! Tell it to us in plain images (A THATCamp/Bloomsday Visualization)
- Infographics: The Fascinating World of (Good) Infographics (and some infographics on bad infographics)
- Infographics: Ending the Infographic Plague, Megan McArdle
- Infographics: We've Reached Peak Infographic, and We're No Smarter for It, Dylan C. Lathrop
- Visualising media: One million manga pages, Lev Manovich and "How to Compare One Million Images?" In David Berry, ed., Understanding Digital Humanities (Palgrave, 2012).
Planning and designing good data visualisations
- How to Design an Excellent Chart is focused on charts for telling stories (rather than exploring to find new ones) and includes Andrew Abela's 'chart chooser' diagram for showing distribution, composition, relationship or comparison data. See also Juice Lab's interactive Chart Chooser.
- Top ten tips on Visualization from Duke Library
- Nominal, Sequential, or Diverging? Simple Strategies for Improving Any Chart’s Colors
- Statistics glossary on Presenting data (for a refresher on ordinal, nominal, interval etc data)
- Effective Graphs blog by Naomi Robbins (including some great 'what not to do' examples)
- Eenie, Meenie, Minie, Moe: Selecting the Right Graph for Your Message (PDF), Stephen Few
- Information Display Tips, Connie Malamed (useful on 'visually distinct objects')
- How to Avoid Designs that Split Attention, Connie Malamed
- Information Visualization Framework, Manuel Lima
- Make for Data Scientists and Introducing Drake, a kind of ‘make for data’ (getting a bit techie but useful for thinking about ways to manage different versions of your datasets as you clean and refine)
On data visualisation for scholarly research
See also the projects listed in specific workshop activities.
- Modeling Networks and Scholarship with ORBIS, Elijah Meeks and Karl Grossner, Journal of Digital Humanities
- Reading digital sources: a case study in ship's logs or Keeping the words in Topic Models, Ben Schmidt (and his blog Sapping Attention on text mining and the digital humanities generally)
- The Six Degrees of Francis Bacon project is blogging entertainingly about 'reassembling the early modern social network'
- HASTAC forum, Visualization Across Disciplines
Critiquing visualisations
- On 'big data' as the next big trend: video from Strata 2013: Kate Crawford, "Algorithmic Illusions: Hidden Biases of Big Data" , or written interview with Crawford at Untangling algorithmic illusions from reality in big data.
- In Liveblogged Review of Macroanalysis by Matthew L. Jockers, Part 2 Scott B. Weingart discusses choices and standards for visual representations of humanities data
- Lattice Uncertainty Visualization: Understanding Machine Translation and Speech Recognition, Christopher Collins, Gerald Penn, Sheelagh Carpendale
- Data visualizations should be as much about facilitating interaction as conveying information, Michael Schrage
- Mia Ridge explores the shape of Cooper-Hewitt collections, me on 'messiness' and humanities data in visualisations on the Cooper-Hewitt Museum Labs blog
- Words Alone: Dismantling Topic Models in the Humanities, Benjamin M. Schmidt
Definitions of data visualisation
- Few, Stephen. 2013. ‘Data Visualization for Human Perception’. Ed. Mads Soegaard and Rikke Friis Dam. The Encyclopedia of Human-Computer Interaction, 2nd Ed. Aarhus, Denmark: The Interaction Design Foundation.
- Visualisation Workflow: Finding Stories and Telling Stories by Andy Kirk (also check out his blog, Visualising Data)
- A Tale of Two Types of Visualization and Much Confusion
- Information Visualization Manifesto, Manuel Lima
Histories of data visualisation
- Milestones in the history of data visualisation
- CABINET // A Timeline of Timelines
- Brody, Howard, Michael Russell Rip, Peter Vinten-Johansen, Nigel Paneth, and Stephen Rachman. 2000. Map-making and myth-making in Broad Street: the London cholera epidemic, 1854. The Lancet 356, no. 9223: 64-68.
- The Changing Goals of Data Visualization
- Flow Map of Napoleon's March on Moscow
General references
- Data Visualization Talks Online, 2010 post from Alark Joshi listing various videos
- Data and visualization blogs worth following (early 2012 post by Nathan Yau)
- Few, Stephen. 2009. Now I See It: Simple Visualization Techniques for Quantitative Analysis. Analytics Press.
- Lima, Manuel. 2011. Visual complexity: mapping patterns of information. New York: Princeton Architectural Press.
- Moretti, Franco. 2005. Graphs, maps, trees: abstract models for a literary history. London: Verso.
- Rosenberg, Daniel, and Grafton, Anthony. 2010. Cartographies of Time: A History of the Timeline. Princeton Architectural Press
- Tufte, Edward R. 1983. The Visual Display of Quantitative Information. Graphics Press.
- Tufte, Edward R. 2007. Beautiful evidence. Cheshire, Conn: Graphics press.
- Ware, Colin. 2008. Visual Thinking for Design. Morgan Kaufmann.
- Yau, Nathan. 2011. Visualize this: the FlowingData guide to design, visualization, and statistics. Indianapolis, Ind: Wiley Pub.
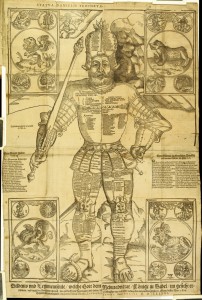
Image: Woodcut of the statue described by the prophet Daniel, from Lorenz Faust’s Anatomia statuae Danielis (“An anatomy of Daniel’s statue”), 1585. In Alan Jacobs, History as wall art.
8 Replies to “Resources for 'Data Visualisation for Analysis in Scholarly Research'”