Workshop: Data Visualizations as an Introduction to Computational Thinking

I gave a half-day pre-conference workshop on ‘Data Visualizations as an Introduction to Computational Thinking’ for the University of Manchester.

From the event blurb:

Digital Humanities (DH) has grown rapidly in importance in recent years, as interest turns away from technology as an instrumental tool simply for resource discovery and access and towards the need to identify and solve new research challenges for the humanities. As one of the largest concentrations of humanities scholars in the UK, surrounded in turn by the enviable breadth of expertise provided by the University’s technologists and librarians, the University could be a fertile ground for Digital Humanities research.

On 7 November 2013, the School of Arts, Languages and Cultures will be hosting an afternoon workshop for University academics and post-graduates; the event is aimed at exploring the skills and literacies researchers might need as potential digital humanists. This informal, hands on event will provide an opportunity for academics, post-grads to start to ‘think like a programmer’ and learn some computational thinking. Participants will be introduced to new methodologies and tools, including those for manipulating and analysing data using visualization tools. No technological expertise in these areas, only a laptop, curiosity and a willingness to experiment.

Goals of session

  • Provide opportunity for academics, post-grads to start to ‘think like a programmer’ and learn some computational thinking
  • Learn and put into practice some skills for accessing, manipulating and analysing data using visualisation tools
  • Introduce new methodologies and tools
  • Demystify tools, think critically about what’s happening ‘under the hood’, understand the impact of tool choice and data structures
  • Enable dialogue with technologists about project design and tool choice
  • Think about the skills, literacies Digital Humanists need

Article 'Creating Deep Maps and Spatial Narratives through Design'

Creating Deep Maps and Spatial Narratives through Design with Don Lafreniere and Scott Nesbit for the International Journal of Humanities and Arts Computing, based on our work at the Summer 2012 NEH Advanced Institute on Spatial Narrative and Deep Maps: Explorations in the Spatial Humanities.

Ridge, Mia; Lafreniere, Don and Nesbit, Scott (2013). Creating deep maps and spatial narratives through design. International Journal of Humanities and Arts Computing, 7(1-2) pp. 176–189.

Abstract: An interdisciplinary team of researchers were challenged to create a model of a deep map during a three-day charette at the NEH Institute on Spatial Narratives and Deep Maps. Through a reflexive process of ingesting data, probing for fruitful research questions, and considering how a deep map might be used by different audiences, we created a wireframe model of a deep map and explored how it related to spatial narratives. We explored the tension between interfaces for exploratory and structured views of data and sources, and devised a model for the intersections between spatial narratives and deep maps. The process of creating wireframes and prototype screens—and more importantly, the discussions and debates they initiated—helped us understand the complex requirements for deep maps and showed how a deep map can support a humanistic interpretation of the role of space in historical processes.

Workshop: Data visualisation as a gateway to programming

I was invited to run a workshop at THATCamp Feminisms West at Scripps College in Claremont, California, and thought 'Data visualisations as gateway to programming' would be a good way to provide a gentle introduction to 'computational thinking' by working through the effects different data structures have on potential visualisations in ManyEyes, the online visualisation tool. I also prepared some material on basic concepts in programming and put together a page of 'Inspiring women through history' mapped across time and space that contained heavily commented code that suggested various things to try to get a sense of how code (in this case, JavaScript, HTML, CSS) works. My slides are below, you can play with content prepared for ManyEyes, or 'view source' at the 'inspiring women' link above, save the file to your hard drive and have a play.


Resources for 'Data Visualisation for Analysis in Scholarly Research'

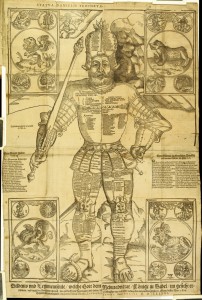
Woodcut of the statue described by the prophet Daniel, from Lorenz Faust’s Anatomia statuae Danielis (“An anatomy of Daniel’s statue”), 1585.
Woodcut, An anatomy of Daniel’s statue, 1585.

A collection of links for further reading for the British Library's Digital Scholarship course on 'Data Visualisation for Analysis in Scholarly Research'. I update this each time I teach the course, so please leave a comment if you know of any great sources I've missed. Slides and exercises for each version of the workshop are below. Many thanks to workshop participants for their feedback, as it directly helps make the next version more effective. And of course huge thanks to Nora McGregor and the British Library's Digital Scholarship team!

Last updated January 2018. Between course revisions I add interesting visualisations to my Scholarly Vision tumblr and pinboard.

Continue reading "Resources for 'Data Visualisation for Analysis in Scholarly Research'"

Links and slides for 'Learning to play like a programmer: Web mash-ups and scripting for beginners'

Workshop abstract: Learning to play like a programmer: web mash-ups and scripting for beginners.

Slides (pdf): Play Like A Programmer workshop DH2012

Links for the Digital Humanities pre-conference workshop 'Learning to play like a programmer: Web mash-ups and scripting for beginners'

My contact details

Twitter: @mia_out, blog openobjects.org.uk, homepage miaridge.com

Text editors

Online javascript console

Data to play with

Visualisation tools

Resources to keep learning

About learning to code

On hack days

Going further with debugging